Monte carlo
Spent the morning running my Horse back systems through monte carlo simulations.
Here are the results per staking plan.
Based on 100,000 simulations per system.
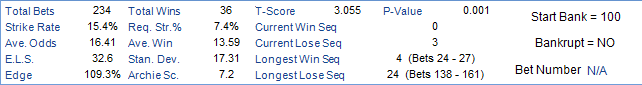
Back system 1:
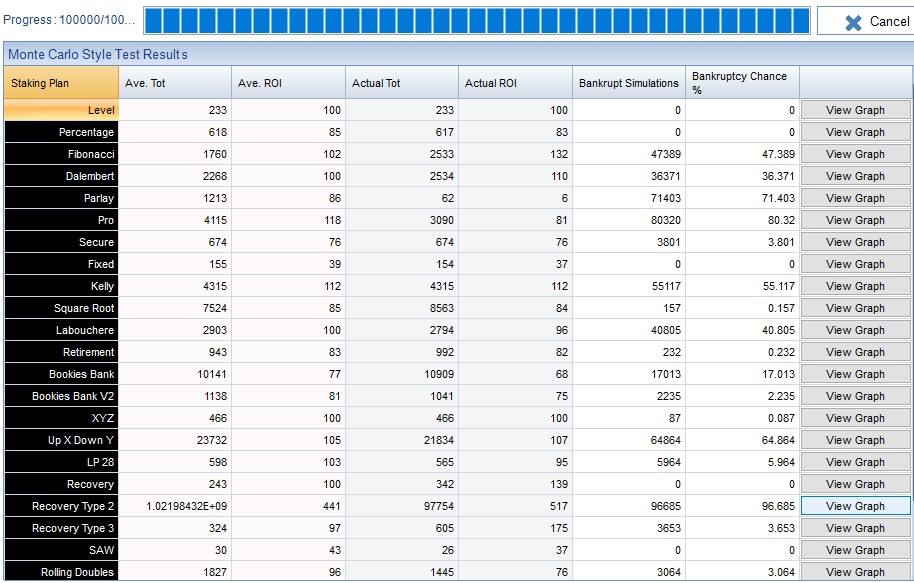
Systems performance to date looks like:
And what it looks like to level stakes, percentage & Square root:
![Level
Percentage
D Fibonacci
Dalembert
Parlay
D Pro
Secure
D Fixed
Z] Square Root
D Labouchere
D Retirement
D Bookies dank
Bookies dank V2
D XYZ
Up X Down Y
D LP 28
D Recovery'
D Recovery' Type 2
Recovery Type 3
D SAW
Rollinq Doubles
Coup Master
D I Point
i-TSM Plan
Update Graph Display
Data All Bets
Line Wdth
Level
8000
7000
6000
5000
4000
3000
2000
1 ooo
50
Percentage
100
Bet Number
Square Root
150
200](https://petestilgoe.com/wp-content/uploads/2021/03/image-18.png)
Back system 2:

Systems performance to date looks like:
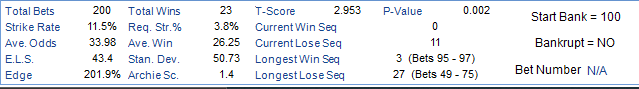
![Level
Level
Percentage
D Fibonacci
Dalembert
Parlay
D Pro
Secure
15
D Fixed
Z] Square Root
D Labouchere
D Retirement
D Bookies dank
Bookies dank V2
D XYZ
z 10
Up X Down Y
D LP 28
Recovery
D Recovery' Type 2
Recovery Type 3
D SAW
Rollinq Doubles
5
Coup Master
D I Point
i-TSM Plan
Update Graph Display
Data All Bets
Line Wdth
50
Percentage
100
Square Root
150
Bet Number](https://petestilgoe.com/wp-content/uploads/2021/03/image-19.png)
As you can clearly see.
Having a winning system is only part of the story.
I am currently running my lay system through 100,000 simulations.
Will update once complete.
